EDC Building | Fault Detection & Diagnostics | Zone Anomalies
Zone Anomalies (Yesterday)
Zone Anomalies
Health Index =
%
Zone Anomalies
The Zone Anomalies charts let you monitor the average air temperature and airflow controls error of each individual zone. VAV units are responsible for delivering the necessary airflow to each discrete zone, and reheat coils or perimeter heaters
provide additional heating to satisfy room temperature setpoints. Uncalibrated, leaky, or seized VAV unit dampers or stuck reheat coil or perimeter heater valves can lead to undesirable air temperatures and excess airflow controls error, causing
occupant discomfort, excess reheat energy use, or poor indoor air quality.
Faulty VAV dampers or reheat coil/perimeter heater valves will result in undesirable indoor air temperature and airflow rates - this is represented as any zones (points)
outside the ideal region.
For VAV units which serve any zone(s) outside the ideal region, it is recommended that these VAV units are investigated for blocked or leaky dampers, or any seized movement of
dampers or reheat coil/perimeter heater valves. If no faults exist, consider recalibrating damper and valve position sensors.
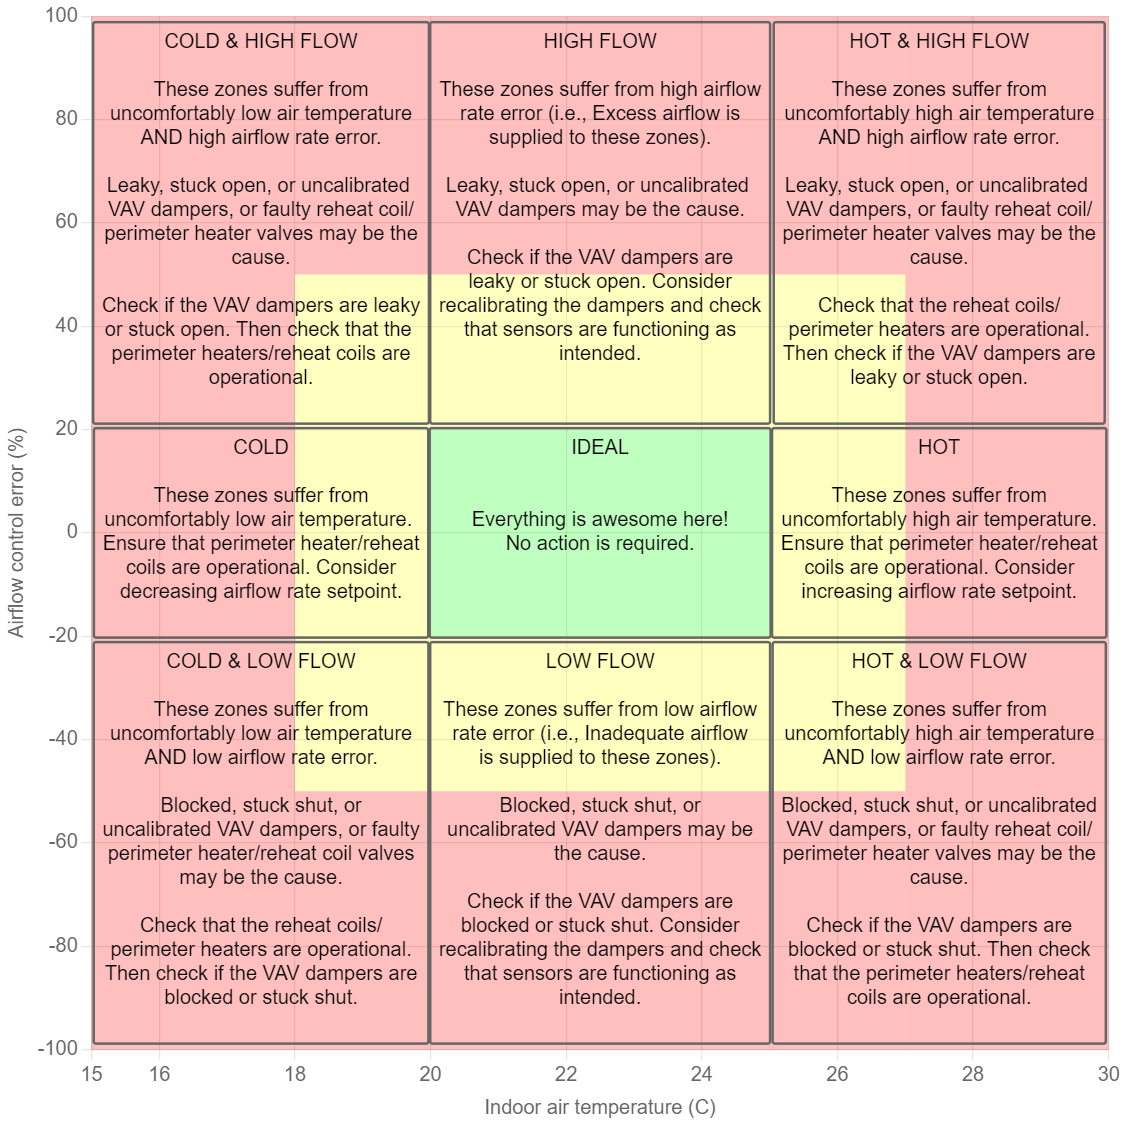
This diagram splits the Zone Anomalies chart into nine(9) distinct regions, and describes the likely cause(s) and recommended diagnostic
measure(s) if a zone or zones fall within these regions - the causes are not limited to those described.
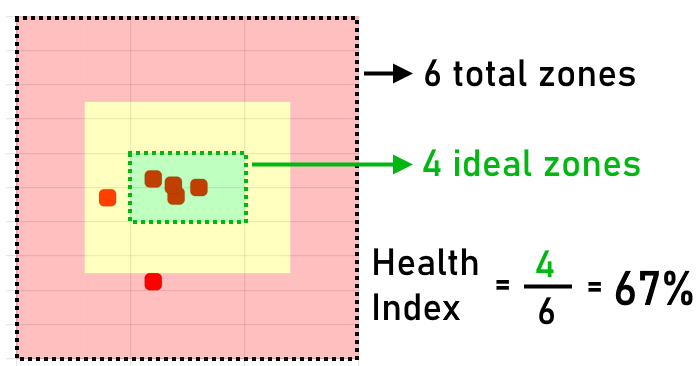
The Health Index is calculated as the fraction of zones (points) within the ideal region over the
total number of zones. In other words, the Health Index is the percentage of healthy operating VAV units over the total number of VAV units. A higher Health Index indicates overall healthy VAV unit reheat operations and indoor conditions.
For example, if there are six(6) total zones and only four(4) are within the ideal region, then the Health Index shall be four(4) over six(6), which is 67%.
NOTE: The Health Index is calculated only for Zone Anomalies, not for Zone Anomalies (Yesterday).
The Zone Anomalies chart was generated by calculating the average indoor air temperature and airflow control error for each thermal zone between 9:00 AM and 5:00 PM local time.
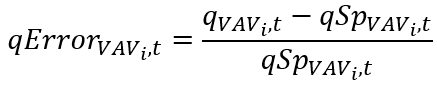
The Zone Anomalies chart presents the overall averages up to the past 12 months while the Zone Anomalies (Yesterday) chart presents the averages only for the previous day. The airflow control error, qError,
for any VAVi at any time t is calculated per Equation A, and is the relative difference between the measured airflow rate q and the setpoint airflow rate qSP.