EDC Building | Fault Detection & Diagnostics | Coil Valves

Delta Air Temperature
Health Index = / %

Coil Valves

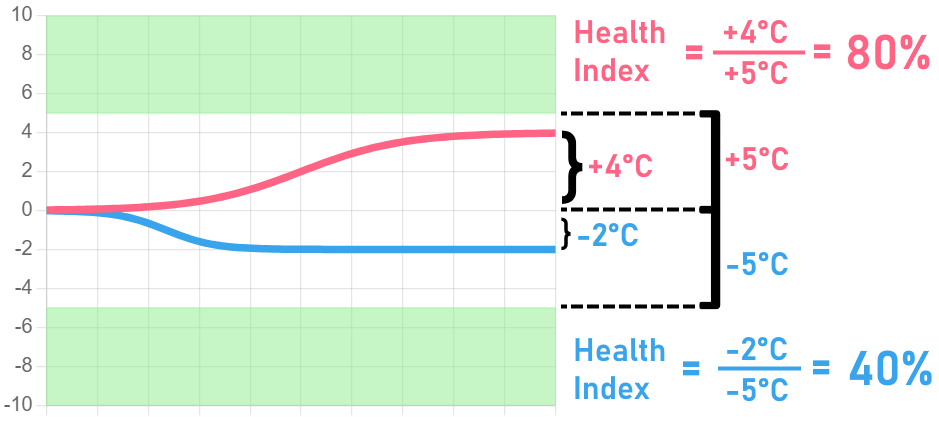
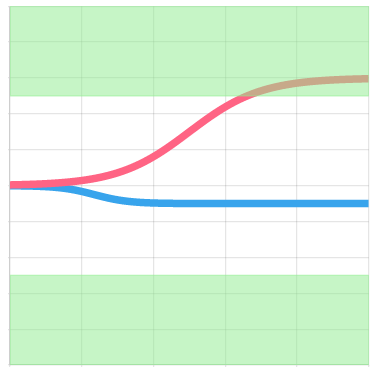
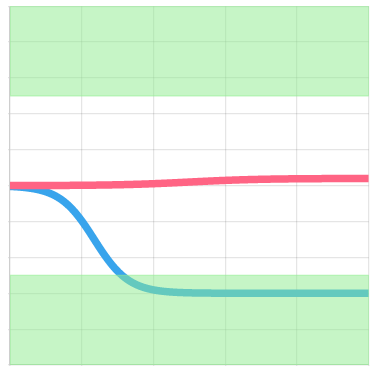
The Delta Air Temperature chart lets you monitor the change in air temperature across the heating and cooling coil. The AHU's heating/cooling coils increase or decrease the temperature of the mixed air to the desired supply/discharge air temperature. A rise in temperature is expected to occur when the heating coils are active (i.e., heating coil valves are open) and decrease when the cooling coils are active. If these changes in air temperature are not observed, a seized or uncalibrated heating/cooling coil valve may be the cause. Faulty coils or valves may result in unexpected supply air temperatures, causing occupant discomfort or excess energy use at the zone/VAV-level as zones struggle to maintain temperature setpoints.

If the Heating Best-Fit Curve or Cooling Best-Fit Curve fails to reach the green highlighted area by a considerable margin, this is indicative of faulty coil valves. Faulty valves can result in inadequate cooling or heating input to the supply/discharge air, leading to unsatisfied room air temperature setpoints and occupant discomfort, or excess fan or reheat energy use.
If faulty coil valves are suspected, it is recommended to investigate for any seized movement of the heating/cooling coil valves. If none exist, consider recalibrating or replacing valve position sensors as they may be faulty and inaccurate, or investigating potential states of operations faults.
NOTE: The Best-Fit Curves are estimated using all available data points. Insufficient data points may produce inaccurate Best-Fit Curves.
Example Delta Air Temperature chart with faulty cooling coil valve.
Faulty cooling coil valve! ❌

Observed: The greatest air temperature change across the cooling coil falls short of -5℃.
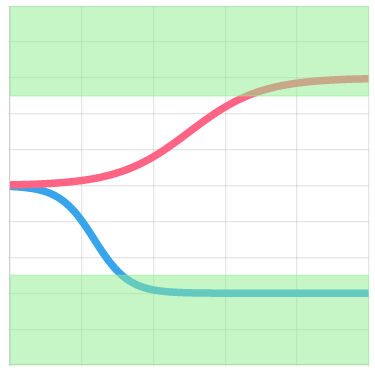
Recommendations: Check cooling coil valves for any seized movement.

Example Delta Air Temperature chart with no faults.
Just right! ✅

Observed: The greatest air temperature change across both the respective coils meets or exceeds ±5℃.

Recommendations: None.

Example Delta Air Temperature chart with faulty heating coil valve.
Faulty heating coil valve! ❌

Observed: The greatest air temperature change across the heating coil falls short of +5℃.

Recommendations: Check heating coil valves for any seized movement.

The Health Index is calculated as the fraction of the greatest observed temperature change (determined by the the Best-Fit Curves) over the ±5℃ target. A higher Health Index indicates healthy operations of coil valves.
For example, if the greatest observed air temperature change across the heating coil was +4℃, then the fraction of +4℃ over +5℃ is [+4℃ / +5℃] = 0.8 - the Health Index shall be 80%. If the greatest observed temperature change meets or exceeds 5℃, then the Health Index shall be 100%. For cooling, the negative temperature change is considered.
NOTE: The respective Health Index shall be 100% if a Heating Best-Fit Curve or Cooling Best-Fit Curve cannot be generated (i.e., too few points to generate).
Example Outdoor Air Ratio chart with too much outdoor air.

The Delta Air Temperature chart was generated using inverse greybox model-based algorithms. First, the mixed air temperature TMA is calculated using the relationship between the outdoor air ratio fOA and mixing box damper position estimated in Mixing Box Dampers (Equation C) and Equation A. The increase or decrease in air temperature across the heating or cooling coils ΔTcoil is calculated by the difference between the supply air temperature TSA and mixed air temperature TMA, as in Equation B. The Heating Best-Fit Curve and Cooling Best-Fit Curve are then fitted to the respective data points by estimating the parameters (a, b, c) of Equation C and plotting the relationship.
FDD MBD Equation A
Equation A
FDD MBD Equation B
Equation B
FDD MBD Equation C
Equation C