EDC Building | Fault Detection & Diagnostics | Supply Air Temperature Reset

Supply/Outdoor Air Temperature
Health Index = %

Supply Air Temperature (SAT) Reset

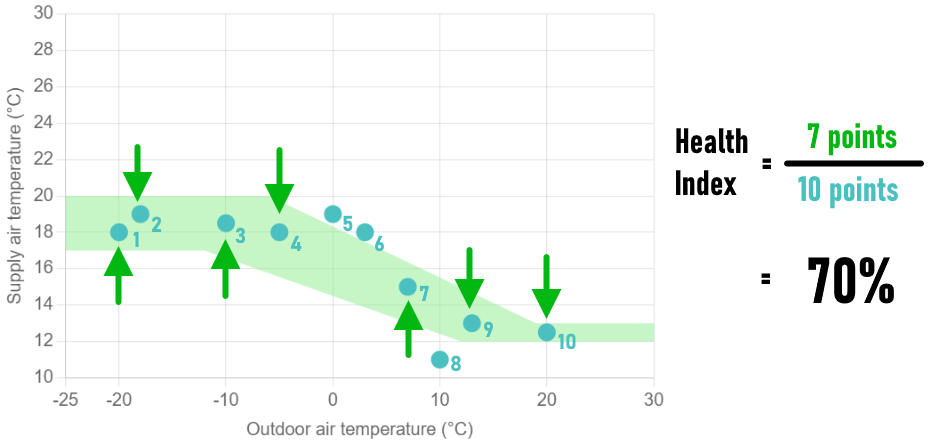
The Supply/Outdoor Air Temperature chart lets you monitor the presence and operation of a supply air temperature (SAT) reset policy by presenting the system-level supply air temperatures relative to outdoor air temperatures. A SAT reset policy is a standard controls strategy that modulates the supply air temperature based on the outdoor air temperature to encourage economizer operation and minimze VAV reheat/perimeter heater energy use. A non-functional or absence of a SAT reset policy may result in excess energy use, particularly from VAV reheat/perimeter heaters.

The Supply/Outdoor Air Temperature chart plots supply air temperatures at respective outdoor air temperatures. If a significant cluster of points falls outside the green highlighted area, or if the points resemble a flat relationship (i.e., similiar/static supply air temperatures across all outdoor air temperatures), a non-functional or absence of a SAT reset policy is likely.
If a non-functional or absence of a SAT reset policy is suspected, it is recommended to create and implement a SAT reset policy using the green highlighted area in the chart as a guide. If one already exists, ensure it is operational.
NOTE: The plotted points represent the supply air temperature and outdoor air temperature relationship during operating hours only (i.e., Monday - Friday, 8 am - 6 pm).
Example Delta Air Temperature chart with faulty cooling coil valve.
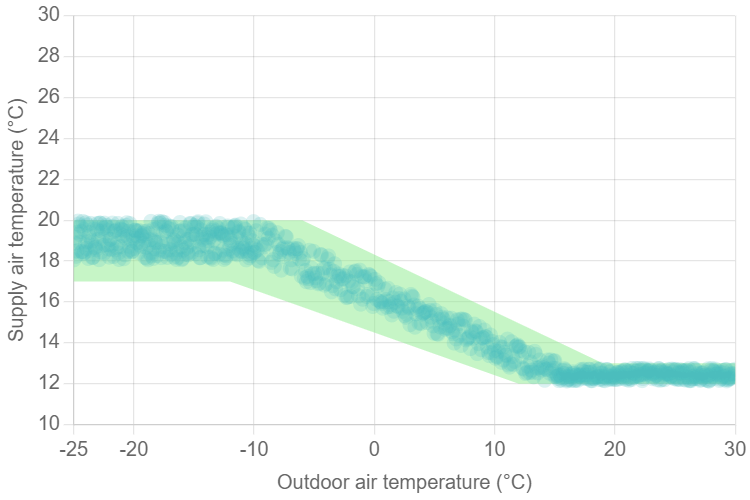
Present and functional SAT reset policy ✅

Observed: The supply air temperature is warmer in the heating season than in the cooling season. This indicates a functional SAT reset controls policy.

Recommendations: None.

Example Delta Air Temperature chart with no faults.
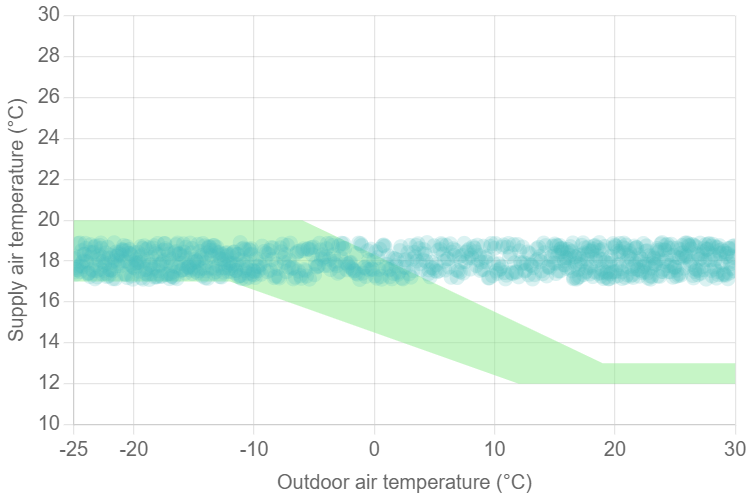
Non-functional or absence of SAT reset policy ❌

Observed: The supply air temperature remains the same in the heating season as is in the cooling season. This indicates a non-functional or absence of a SAT reset policy.

Recommendations: If one does not exist, create and implement a SAT reset policy in the sequences of operations, using the green highlighted area in the chart as a guide. If one exists, ensure it is operational.

Example calculation of health index for Zone Anomalies.
The Health Index is calculated as the fraction of points within the green highlighted area over the total number of points plotted. A higher Health Index indicates a present and functional SAT reset policy.
For example, if there is a total of ten (10) points plotted, and seven (7) of those points fall within the green highlighted area, then the Health Index shall be 70%.

The Supply/Outdoor Air Temperature chart was generated simply by plotting the measured supply air temperature at their respective outdoor air temperature for each timestamp between Monday - Friday and 8 am - 6 pm. The green highlighted area represents the expected relationship between supply and outdoor air temperature for an optimal supply air temperature reset policy[source].