EDC Building | Fault Detection & Diagnostics | VAV Unit Airflow
VAV Airflow
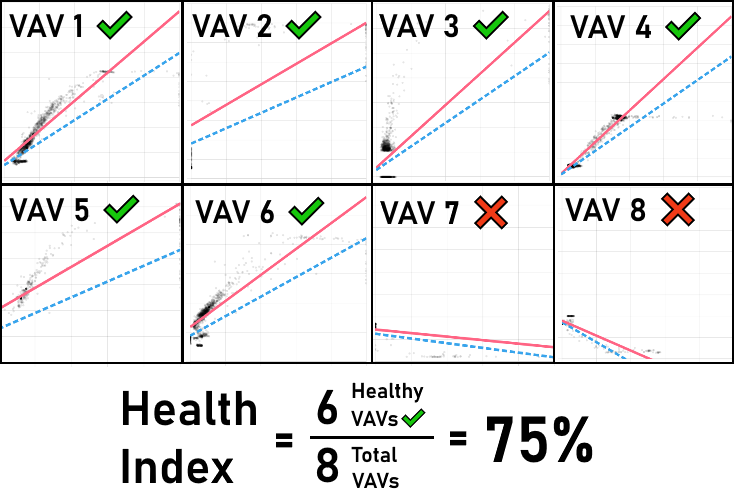
Health Index =
%
Suspected faulty VAV dampers
VAV Unit Airflow
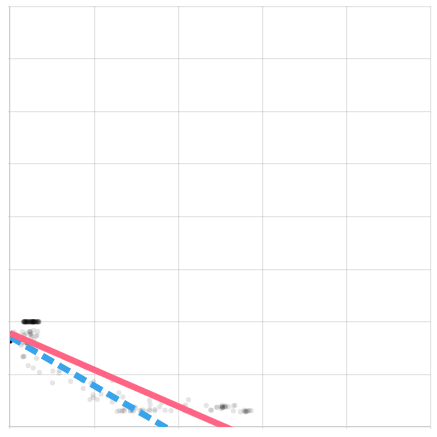
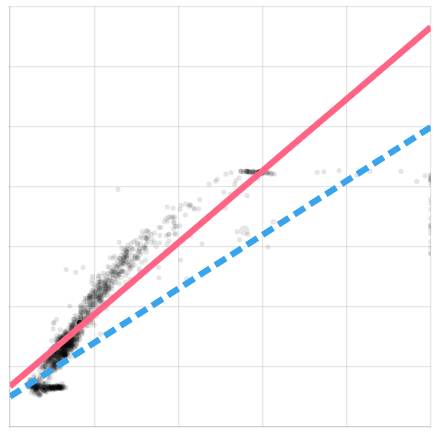
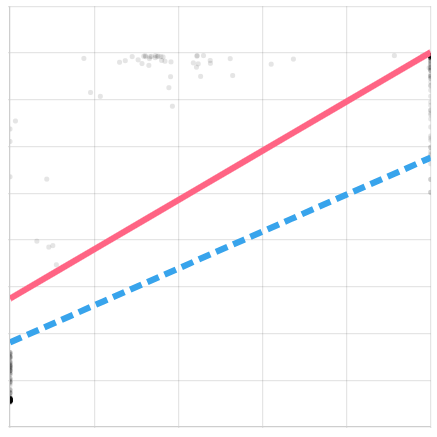
The VAV Airflow chart identifies VAV units with anomalous airflow characteristics and plots the relationship between damper position and airflow rate at a discharge air pressure of 200 Pa
and 400 Pa, separately, of faulty VAV units. VAV units are responsible for delivering the necessary airflow to each discrete zone. However, uncalibrated or seized VAV unit dampers can lead to
insufficient airflow delivery, resulting in occupant discomfort or poor indoor air quality.
The zonal airflow rate is expected to increase as the VAV unit damper opens wider (approaching 100% fully open). If a unit does not exhibit this relationship (i.e., As the damper opens wider, decreased airflow results),
the VAV unit is considered faulty.
If faulty units were identified, it is recommended that faulty units are investigated for any blockages or seized movement of the dampers. If none exists, consider recalibrating or replacing the damper position sensor as it may be faulty and inaccurate. Faulty units
are identified and listed in the table on the left, and the relationship between damper position and airflow rate can be monitored on the right.
NOTE: Faulty VAV units are presented ONLY, that is units that exhibit an inverse relationship between damper position and airflow rate (i.e., lesser airflow rate at wider damper positions). The table and dropdown menu
do not represent the total number of VAV units available.
Faulty VAV unit! ❌
May cause poor indoor air quality.
Recommendations: Check VAV unit dampers for blocks and any seized movement.
Just right! ✅
Healthy operations.
Recommendations: None.
Just right! ✅
Healthy operations.
Recommendations: None.
The Health Index is calculated as the fraction of healthy VAV units over the total number of units. A higher Health Index indicates overall healthy operations of VAV unit dampers.
For example, if two(2) VAV units were identified as faulty out of eigth(8) total units, then six(6) units are considered healthy and the Health Index shall be six(6) over eight(8),
which is 75%.
The VAV Airflow chart was generated through inverse modeling. Using the measured relationship between VAV unit damper position sDmpVAV and airflow rate q, the relationship
at a discharge air pressure of 200 Pa and 400 Pa were generated, separately, by estimating the
parameters (a, b) of Equation A for each discrete VAV unit VAVi. If the parameter a was detrmined to be negative(-) at either discharge air pressure, then the VAV unit shall be considered faulty.